Performance Insights With Stacking Plan Software
Turn Occupancy Data into Actionable Insights
The Challenge
How StackPlanner Helps
- Understand occupancy trends over time
- Spot risk concentrations across tenants or floors
- Compare performance across buildings
- Support data-driven reviews and planning
Results You Can Expect
- Clear performance benchmarks
- Stronger asset strategies
- More informed stakeholder discussions
Your Questions, Answered
What are performance insights in commercial real estate?
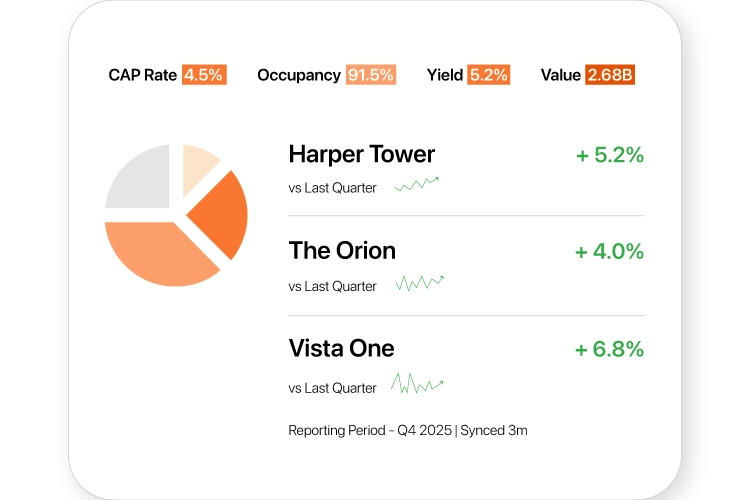
Performance insights are data-driven understandings of occupancy trends, risk concentration, and asset performance across buildings and portfolios.
Why are visual insights better than raw occupancy data?
Visual insights reveal patterns and trends that raw data cannot, enabling strategic planning instead of reactive performance reviews.
How can CRE teams analyze occupancy trends effectively?
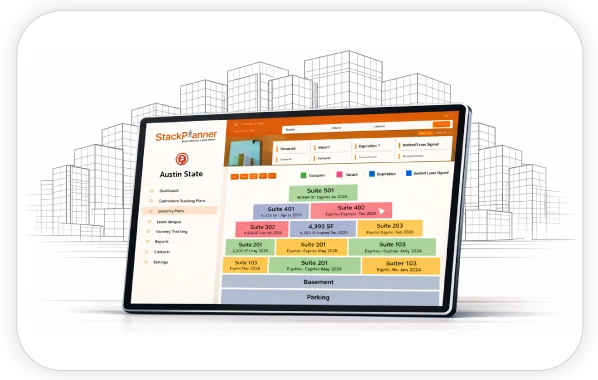
CRE teams can analyze occupancy trends using visual analytics tools like StackPlanner that track changes over time across floors and buildings.
What role does performance analytics play in asset strategy?
Performance analytics support better asset strategies by providing clear benchmarks, comparative views, and data-backed insights for stakeholders.
How does StackPlanner turn data into actionable insights?
StackPlanner transforms static occupancy data into visual dashboards that highlight trends, risks, and performance comparisons across assets.